|
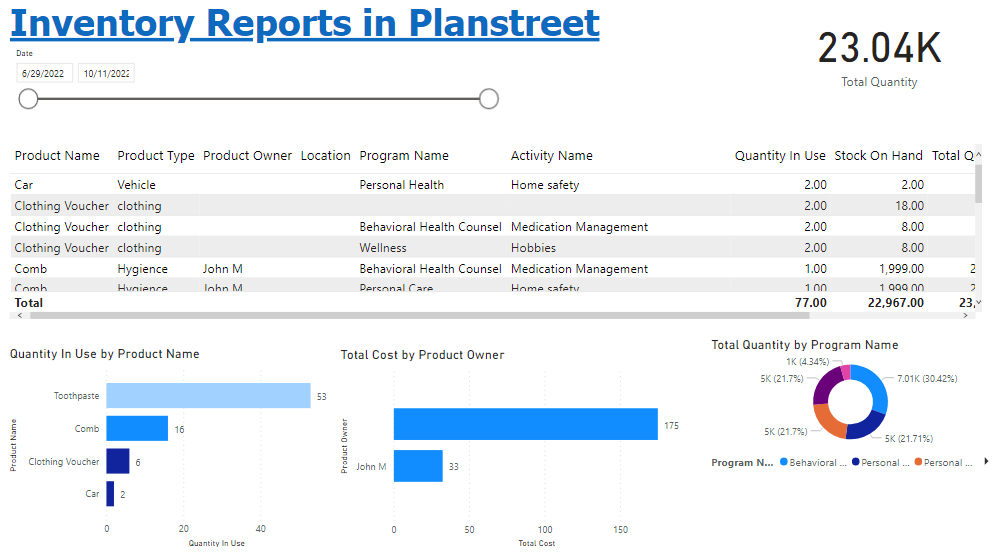
In PlanStreet, the Dashboard is a versatile tool that allows users to create reports by leveraging data from forms, intake, and case boards through simple drag-and-drop interactions. Here's how the Dashboard works in PlanStreet:
Dashboard Integration Overview:
- The Dashboard is designed to generate reports that cater to the user's specific needs.
- It integrates all the system modules, providing access to data from different system parts in one place, enabling dynamic visualization and robust report creation.
- It offers the flexibility to customize and create reports using data fields relevant to your organization's requirements.
View Menu:
The "View" menu in the Dashboard provides various options to control the display of report pages:
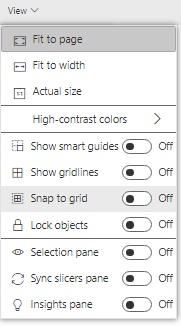 |
- Actual Size: This option increases the size of the report page, making it more readable on small devices. You can use scroll bars to navigate the page.
- Fit to Width: This option adjusts the report width to fit your screen, but it might require using the vertical scroll bar for taller reports.
- Fit to Page: This option optimizes the report to fully utilize your screen size. It minimizes the need for scroll bars while providing an efficient layout.
- Full Screen: This option displays your report without menu bars and headers. It's useful for viewing purposes on small screens or when projecting reports on a larger screen.
|
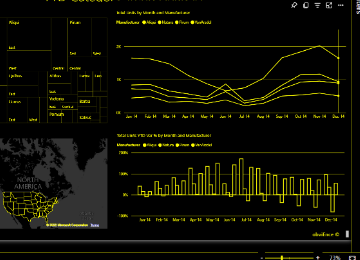
| High Contrast Colors: PlanStreet offers various high-contrast color schemes, such as High-contrast #1, High-contrast #2, High-contrast black, or High-contrast white. These options are designed to help users with impaired vision read reports more effectively. |
 |
|
Additional Dashboard Features:
- Smart Guides: These are lines on the canvas that help align visuals with precision, similar to the alignment guides in software like PowerPoint. They assist in ensuring that edges are appropriately aligned.
- Gridlines and Snap-to-Grid: Users can enable gridlines on the canvas to help align visuals more efficiently, and the snap-to-grid feature assists in precise positioning.
- Lock Object: This feature allows users to lock a visual, preventing unintended changes or adjustments.
- Selection Pane: The selection pane shows the layered structure of the visuals, making it easier to manage the arrangement and visibility of elements.
- Sync Pane: The sync pane enables slicer actions to be reflected on other report pages, enhancing data consistency.
- Insight Pane: This feature helps configure the order and layout of insight visuals on report pages, facilitating effective data presentation.
|
The PlanStreet Dashboard provides a user-friendly and feature-rich environment for creating, customizing, and viewing reports, empowering organizations to easily extract valuable insights from their data.
|
