|
Visualizations are essential for effective data presentation in Power BI and other data analysis tools. Here's a guide to creating standard visualizations in Power BI:
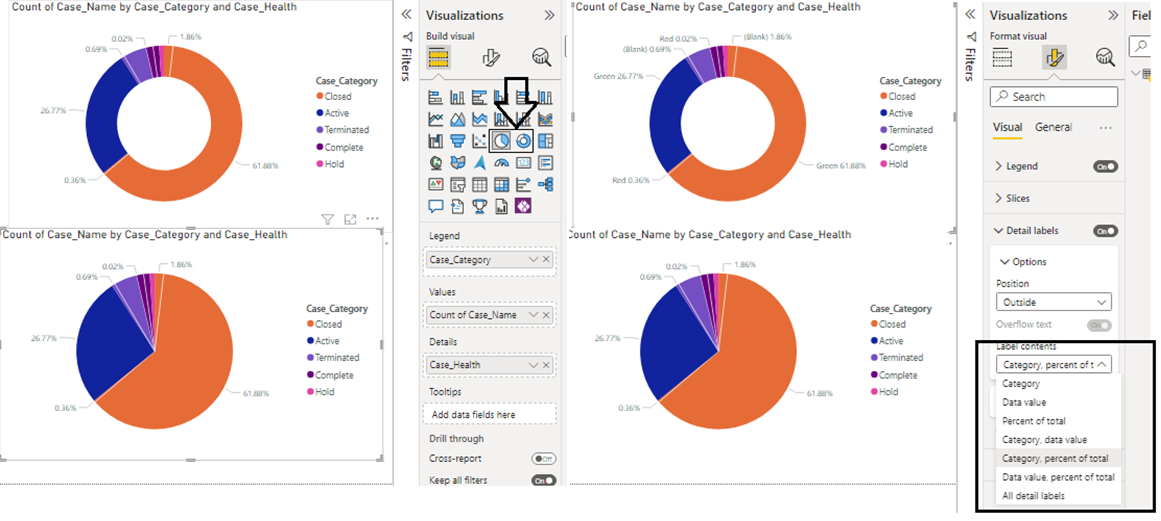
Doughnut Chart:
-
A Doughnut Chart is a circular chart with a hole in the center, resembling a doughnut. It is used to represent data in a segmented, categorical manner.
-
It is suitable for displaying the distribution of parts within a whole. Each segment represents a category, and the size of each segment corresponds to the proportion of that category in the total.
Pie Chart:
-
A Pie Chart is a circular chart that divides data into slices to illustrate numerical proportions. The entire pie represents 100%.
-
It's used to show the relationship of parts to a whole, making it easy to compare the sizes of different categories or segments.
Steps to create a Doughnut and Pie Charts:
-
Start with a blank report page.
-
In the Fields pane, select the data field you want to visualize (e.g., Last Year Sales).
-
In the Visualizations pane, click the Doughnut or Pie Chart icon to create the chart. If your data field isn't in the Values area, drag it there.
-
Customize the visual by adjusting formatting options as needed.
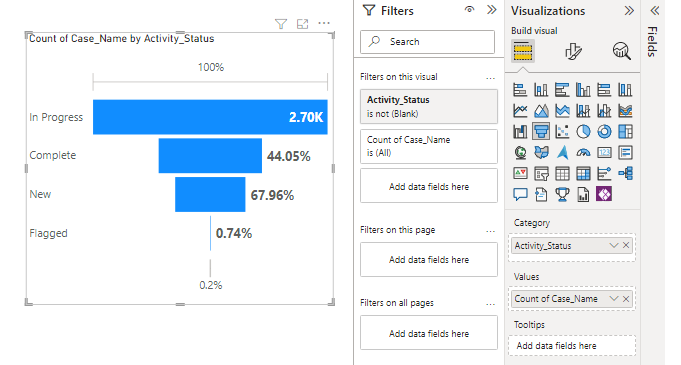
Funnel Chart:
-
A Funnel Chart is a specialized chart that visualizes a process with sequential stages. It resembles a funnel, where the first stage is the widest, and each subsequent stage narrows.
-
It's used for tracking and analyzing processes, particularly sales or conversion processes. The size of each stage represents the percentage of items moving from one stage to the next.
Steps to create a Funnel Chart:
-
In a blank report page, select the data field you want to use for the funnel stages.
-
In the Visualizations pane, click on the Funnel Chart icon to create the funnel chart.
-
Add the values you want to measure to the Fields section.
-
Format your visual to match your requirements.
|
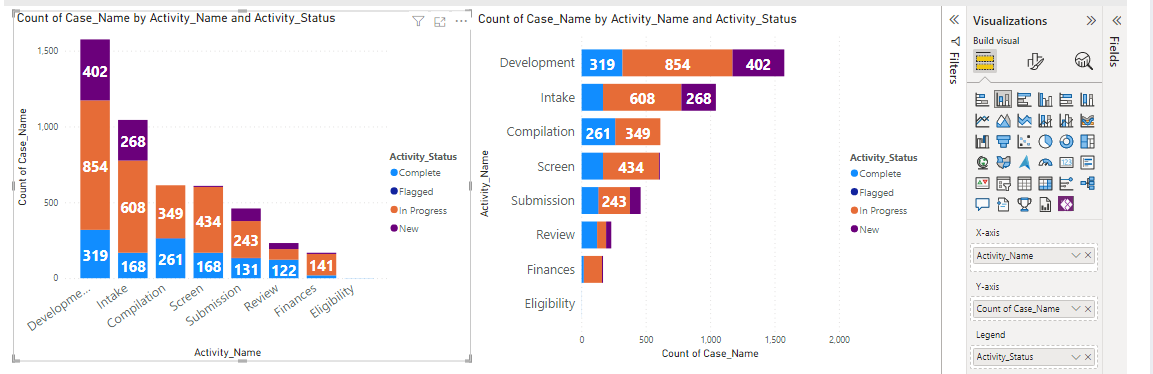
Bar Chart:
-
A Bar Chart is a chart with rectangular bars, where the length or height of each bar represents a data value. Bar charts can be vertical (columns) or horizontal (bars).
-
They are commonly used for comparing data between different categories or showing changes over time.
Column Chart:
-
A Column Chart is essentially a vertical bar chart where data values are represented by the height of the columns.
-
It's useful for displaying data in categories and comparing the values of different categories.
Steps to create a Bar and Column Charts:
-
Start with a blank report page.
-
In the Visualizations pane, select either the Bar or Column Chart icon based on your preference.
-
Add the data fields to the Values, X-axis, and Legend sections to define your chart.
-
Customize the chart as needed, including labels, colors, and other formatting options.
|
|
|
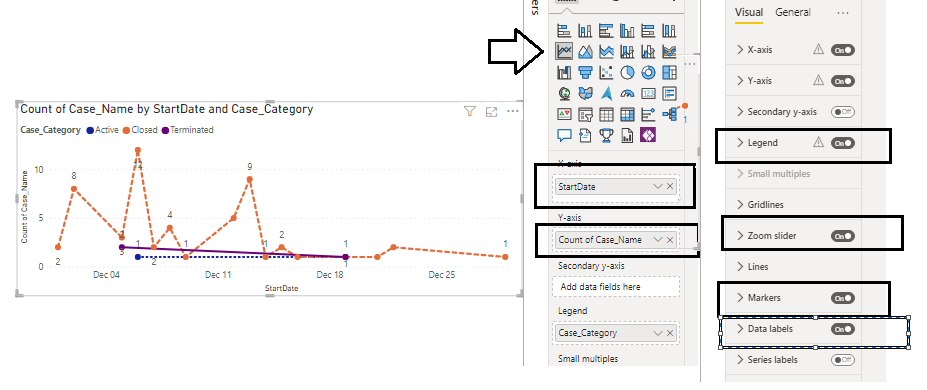
Line charts:
-
A Line Chart displays data as a series of data points connected by straight lines. It is commonly used to visualize trends over a continuous interval, such as time.
-
It's ideal for showing how data changes over time and identifying patterns and trends.
Steps to create a Line Chart:
-
Create a new report page.
-
In the Visualizations pane, select the Line Chart icon.
-
Add the data fields to the Values, X-axis, and Legend sections to configure your line chart.
-
Customize the chart's appearance, including line styles, colors, and labels.
In Summary:
These are the basic steps for creating various visualizations in Power BI. Each type of chart or graph has specific use cases, and you can customize them to fit your data and reporting requirements. These visualizations serve different purposes, and choosing the right one depends on the nature of your data and the insights you want to communicate to your audience.
|
